What ho, ladies! And what ho, gentlemen! The hack is on and apace. Today, the topic is performance: of Guile and of its web server, in microseconds and kiloinstructions. Brew up a pot of tea; this is a long article.
the problem
I have been poking at Guile's web server recently. To recap, Guile is an implementation of Scheme. It is byte-compiled, and has a set of runtime libraries written in C and, increasingly, in Scheme itself.
Guile includes some modules for dealing with the web: HTTP, clients, servers, and such. It's all written in Scheme. It runs this blog you're reading right now.
To be precise, this web log is served by tekuti, an application written on top of Guile's web server; and actually, in this case there is Apache in front of everything right now, so you're not talking directly to Guile. Perhaps that will change at some point.
But anyway, a few months ago, this blog was really slow to access. That turned out to be mostly due to a bug in tekuti, the blog application, in which generating the "related links" for a post would always end up invoking git. (The database for the blog is implemented in git.) Spawning another process was slow. Fellow hacker and tekuti user Aleix Conchillo Flaqué fixed the problem a year ago, but it took a while for it me to finally review and merge it.
So then, at that point, things were tolerable, but I had already contracted the performance bug, so I went on to spend a couple months drilling down, optimizing Guile and its web server -- the layers below tekuti.
10K requests per second: achievement unlocked!
After a lot of tweaking, to the compiler, runtime, HTTP libraries, and to the VM, Guile can now serve over 10000 requests per second on a simple "Hello world" benchmark. This is out of the box, so to speak, if the master branch in git were a box. You just check out Guile, build it using the normal autoreconf -vif & & ./configure && make dance, and then run the example uninstalled:
$ meta/guile examples/web/hello.scm
In another terminal, you can connect directly to the port to see what it does. Paste the first paragraph of this and press return, and you should see the second part:
$ nc localhost 8080
GET / HTTP/1.0
Host: localhost:8080
User-Agent: ApacheBench/2.3
Accept: */*

HTTP/1.0 200 OK
Content-Length: 13
Content-Type: text/plain;charset=utf-8

Hello, World!
I should say a little more about what the server does, and what the test application is. It reads the request, and parses all the headers to native Scheme data types. This is strictly more work than is needed for a simple "pong" benchmark, but it's really useful for applications to have all of the headers parsed for you already. It also filters out bad requests.
Guile then passes the request and request body to a handler, which returns the response and body. This example's handler is very simple:
(define (handler request body)
  (values '((content-type . (text/plain)))
          "Hello, World!"))
It uses a shorthand, that instead of building a proper response object, it just returns an association-list of headers along with the body as a string, and relies on the web server's sanitize-response to produce a response object and encode the body as a bytevector. Again, this is more work for the server, but it's a nice convenience.
Finally, the server writes the response and body to the client, and either closes the port, as in this case for HTTP/1.0 with no keep-alive, or moves the client back to the poll set if we have a persistent connection. The reads and writes are synchronous (blocking), and the web server runs in one thread. I'll discuss this a bit more later.
You can then use ApacheBench to test it out:
$ ab -n 100000 -c100 http://localhost:8080/
Server Software:
Server Hostname:        localhost
Server Port:            8080

Document Path:          /
Document Length:        13 bytes

Concurrency Level:      100
Time taken for tests:   9.631 seconds
Complete requests:      100000
Failed requests:        0
Write errors:           0
Total transferred:      9200000 bytes
HTML transferred:       1300000 bytes
Requests per second:    10383.03 [#/sec] (mean)
Time per request:       9.631 [ms] (mean)
Time per request:       0.096 [ms] (mean, across all concurrent requests)
Transfer rate:          932.85 [Kbytes/sec] received

Connection Times (ms)
              min  mean[+/-sd] median   max
Connect:        0    0   0.1      0       3
Processing:     1   10   1.7      9      20
Waiting:        1   10   1.7      9      20
Total:          3   10   1.7      9      20

Percentage of the requests served within a certain time (ms)
  50%      9
  66%      9
  75%     12
  80%     12
  90%     12
  95%     12
  98%     13
  99%     13
 100%     20 (longest request)
I give you the whole printout because I find it interesting. There's no huge GC pause anywhere. This laptop has an Intel i7-2620M 2.70GHz CPU. It was bought last year, so it's recent but not fancy. There are two cores, and so part of one core is being used by ApacheBench, and the whole other one used by Guile.
Of course, this is a flawed benchmark. If you really care about this sort of thing, Mark Nottingham wrote a nice article on HTTP benchmarking last year that shows all the ways in which this test is wrong.
However, flawed though it is, this test serves my purposes: to understand the overhead that Guile and its web server imposes on a web application.
So in that light, I'd like to take apart this test and try to understand its performance. I'll look at it from three directions: bottom-up (using low-level profiling), top-down (using a Scheme profiler), and transverse (profiling the garbage collector).
bottom-up: clock cycles, instructions retired
The best way to measure the performance of an application is with a statistical profiler. Statistical profiling samples what's really happening, without perturbing the performance characteristics of your application.
On GNU/Linux systems, we have a few options. None are really easy to use, however. Perf comes the closest. You just run perf record -g guile examples/web/hello.scm, and it records its information. Then you run perf report and dive into the details through the mostly pleasant curses application.
However, for some reason perf could not capture the call graphs, in my tests. My machine is x86-64, which does not include frame pointers in its call frames, so perhaps it was a naive stack-walking algorithm. The associated DWARF information does include the necessary stack-walking data.
Anyway, at least you can get a good handle on what individual functions are hot, and indeed what source lines and instructions take the most time. These lowest-level statistical profilers typically sample based on number of clock cycles, so they correspond to real time very well.
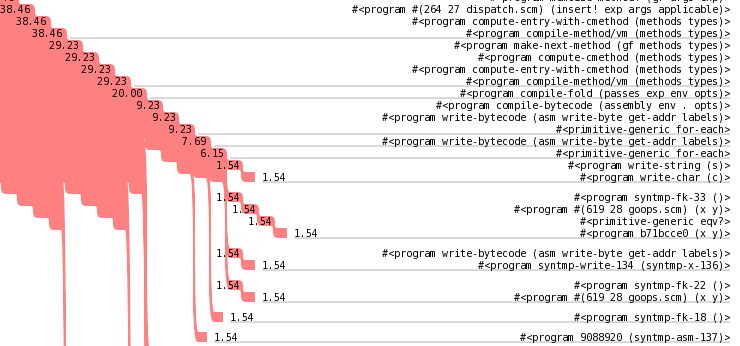
So much for measurement. For actually understanding and improving performance, I find valgrind's callgrind tool much more useful. You run it like this:
valgrind --tool=callgrind --num-callers=20 /path/to/guile examples/web/http.scm
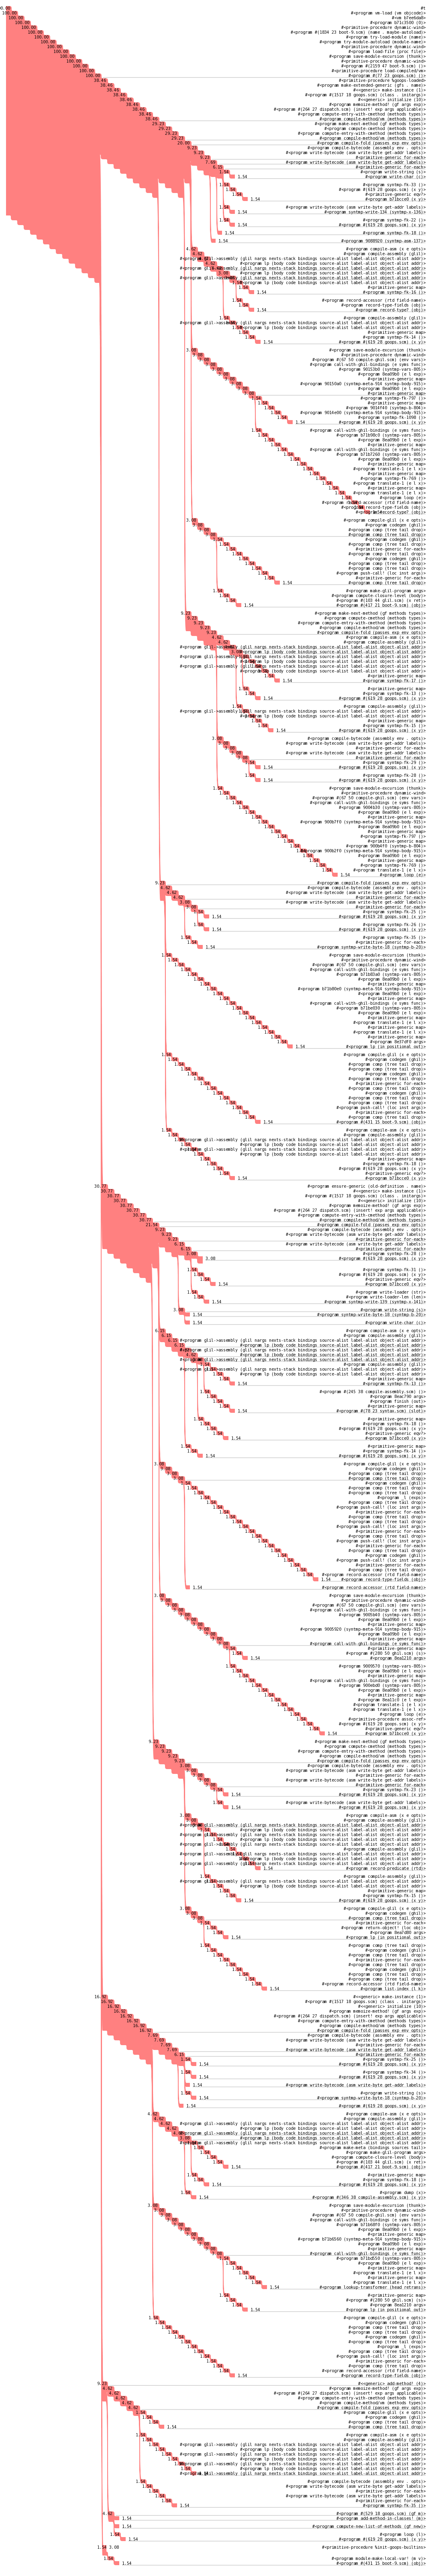
Valgrind can record the execution of your program as it runs, tracking every call and every instruction that is executed. You can then explore the resulting log with the kcachegrind graphical tool. It's the best thing there is for exploring low-level execution of your program.
Now, valgrind is not a statistical profiler. It slows down and distorts the execution of your program, as you would imagine. Beyond those caveats, though, you have to keep two things in mind: firstly, that a count of instructions executed does not correspond directly to clock cycles spent. There are memory latencies, cache misses, branch mispredictions, and a whole host of randomnesses that can affect your runtime. Secondly, valgrind only records the user-space behavior of your program. I'll have more to say on that later.
If I run the "hello.scm" benchmark under valgrind, and hit it with a hundred thousand connections, I can get a pretty good idea what the aggregate behavior of my program is. But I can do better than big-picture, for this kind of test. Given that this test does the same thing a hundred thousand times, I can use valgrind's accurate call and instruction counts to give me precise information on how much a single request takes.
So, looking at the total instruction and call counts, and dividing by the number of requests (100K), I see that when Guile handles one request, the algorithmic breakdown is as follows:
| instructions per request | percentage of total | procedure | calls per request |
|---|
| 250K | 100 | (total) | - |
| 134K | 52.5 | bytecode interpretation | - |
| 47K | 18.5 | port buffer allocation | 1 |
| 18K | 7.2 | display | 1 |
| 7.6K | 3 | allocation within VM (closures, pairs, etc) | 83 |
| 7.2K | 2.84 | read-line | 5 |
| 3.6K | 1.40 | substring-downcase | 3 |
| 3.2K | 1.24 | string->symbol | 4 |
| 3.1K | 1.23 | accept | 1 |
| 2.7K | 1.06 | substring | 11 |
| 2.6K | 1.03 | string-index | 8 |
| 2.5K | 1.00 | hashq-ref | 14 |
| 23K | 9 | other primitives < 1% each | - |
Guile's ports can be buffered, like C's stdio FILE* streams, and the web server does turn on buffering. The 18.5% of the time spent allocating port buffers seems like a ripe place for optimization, but digging into it, almost all of the time within those routines is spent in the garbage collector, and most of that marking the heap. Switching to a generational collector could help here, but I'm not sure how much, given that port buffers are probably 4 KB each for input and output, and thus might not fit into a young generation. Marking from more threads at once could help -- more on that in some future essay.
There are some primitives that can be optimized as well, but with the VM taking up 52% of the runtime, and 23% for allocation and the garbage collector, Amdahl's law is against us: making the primitives twice as fast would result only a 15% improvement in throughput.
Turning Amdahl's argument around, we can predict the effect of native compilation on throughput. If Guile 2.2 comes out with native compilation, as it might, and that makes Scheme code run 5 times faster (say), then the 50% of the instructions that are currently in the VM might drop to 10% -- leading to an expected throughput improvement of 67%.
top-down: scheme-level profiling with statprof
But what is going on in the VM? For that, I need a Scheme profiler. Fortunately, Guile comes with one, accessible at the REPL:
$ guile --no-debug
> ,profile (load "examples/web/hello.scm")
%     cumulative   self
time   seconds     seconds      name
 15.42      1.55      1.55  close-port
 11.61      1.17      1.17  %after-gc-thunk
  6.20      1.65      0.62  setvbuf
  4.29      0.43      0.43  display
  3.34      0.35      0.34  accept
  2.86      0.35      0.29  call-with-error-handling
  2.38      0.24      0.24  hashq-ref
  2.23      9.16      0.22  with-default-trap-handler
  2.07      0.67      0.21  build-response
  1.75      1.17      0.18  sanitize-response
...
Sample count: 629
Total time: 10.055736686 seconds (1.123272351 seconds in GC)
(I use the --no-debug argument to avoid some per-VM-instruction overhead imposed by running Guile interactively; see VM Hooks for more.)
Here I get a really strange result. How is close-port taking all the time? It's implemented as a primitive, not in Scheme, and Valgrind only thought it took 0.40% of the instructions. How is that?
To answer this, we need to remember a couple things. First of all, we recall that Guile's statistical profiler uses setitimer to get signals delivered periodically, after some amount of time spent on the program's behalf, including time spent in the kernel. Valgrind doesn't account for system time. So here we are seeing that close-port is indeed taking time, specifically to flush out the buffered writes. The time is really being spent in the write system call.
So this is good! We know now that we should perhaps look at tuning the kernel to buffer our writes better.
We can also use the profiling data counts to break down the time spent in serving one request from a high level. For example, http-read handles traversing the poll set and accepting connections, and tail-calls read-request to actually read the request. Looking at the cumulative times in the chart tells me that out of each request, the time spent breaks down like this:
| microseconds per request | procedure |
|---|
| 100 | (total) |
| 29 | poll and accept |
| 16 | reading request |
| 0 | request handler |
| 12 | sanitize-response |
| 8 | writing response headers |
| 0 | writing response body |
| 15 | close-port |
| 20 | other |
Of course, since this is statistical, there is some uncertainty about the whole thing. Still, it seems sensible enough.
transverse: who is doing all the allocating?
Often when you go to optimize a Scheme program, you find that it's spending a fair amount of time in garbage collection. How do you optimize that? The rookie answer to this is to try to patch the collector to allocate faster, or less frequently, or something. Veterans know that the solution to GC woes is usually just to allocate less. But how do you know what is allocating? GC is a fairly transverse cost, in that it can charge the good parts of your program for the expenses of the bad.
Guile uses the Boehm-Demers-Weiser conservative collector. For what it is, it's pretty good. However its stock configuration does not provide very much insight into the allocation patterns of your program. One approximation that can be made, though, is that the parts of the program that cause garbage collection to run are the parts that are allocating the most.
Based on this insight, Guile includes a statistical profiler that samples when the garbage collector runs. One thing to consider is that GC probably doesn't run very often, so for gcprof tests, one might need to run the test for longer. In this example, I increased the load to a million requests.
$ guile --no-debug
> (use-modules (statprof))
> (gcprof (lambda () (load "examples/web/hello.scm")))
%     cumulative   self
time   seconds     seconds      name
 86.55     82.75     82.75  setvbuf
  9.37      8.96      8.96  accept
  1.70      1.63      1.63  call-with-error-handling
  1.31      1.25      1.25  %read-line
  0.29      0.28      0.28  substring
  0.24      0.23      0.23  string-downcase
  0.10     91.80      0.09  http-read
  0.10      0.09      0.09  parse-param-list
  0.10      0.09      0.09  write-response
---
Sample count: 2059
Total time: 95.611532937 seconds (9.371730448 seconds in GC)
Here we confirm the result that we saw in the low-level profile: that the setvbuf Scheme procedure, which can cause Guile to allocate buffers for ports, is the primary allocator in this test.
Another interesting question to answer is, "how much are we allocating, anyway?" Using the statistics REPL command, I can see that the 100K requests entailed a total allocation of about 1.35 GB, which divides out to 13.5 KB per request. That sounds reasonable: about 4 KB each for the read and write buffers, and some 4 KB of various other allocation: strings, pairs, the final bytevector for output, etc.
The test incurred 220 stop-the-world garbage collections. So, about 1 out of 450 (0.2%) of requests trigger a GC. The average GC time seems to be about 5 ms (1100 ms / 220 times). That squares fairly well with our last-percentile ApacheBench results.
The total heap size is modest: 14 megabytes. It does not leak memory, thankfully. If I run mem_usage.py on it, I get:
Mapped memory:
               Shared            Private
           Clean    Dirty    Clean    Dirty
    r-xp    1236        0     1028        0  -- Code
    rw-p      24        0       28      160  -- Data
    r--p      60        0     1580      112  -- Read-only data
    ---p       0        0        0        0
    r--s      24        0        0        0
   total    1344        0     2636      272
Anonymous memory:
               Shared            Private
           Clean    Dirty    Clean    Dirty
    r-xp       4        0        0        0
    rw-p       0        0        0    11652  -- Data (malloc, mmap)
    ---p       0        0        0        0
   total       4        0        0    11652
   ----------------------------------------
   total    1348        0     2636    11924
Native ahead-of-time compilation would allow for more shareable, read-only memory. Still, as it is, this seems acceptable.
a quick look at more dynamic tests
That's all well and good, you say, but it's a fairly static test, right?
For that I have a couple of data points. One is the simple SXML debugging test in examples/test/debug-sxml.scm, which simply spits back the headers that it receives, wrapped in an HTML table. The values are printed as the Scheme object that they parse to. Currently, I have a version of this script running on my site. (You can see the headers that Apache adds on, there.)
Testing it as before tells me that Guile can serve 6000 of these pages per second, on my laptop. That's pretty respectable for an entirely dynamic page that hasn't been optimized at all. You can search around the net for comparable tests in other languages; I think you'll find Guile's performance to be very good.
The other point to mention is Tekuti itself. Tekuti includes a caching layer in the application, so after the first request, it's not really a dynamic test. It does check to make sure its caches are fresh on every round, though, by checking the value of the refs/heads/master ref. But still, it is a test of pushing a lot of data; for my test, the page is 50 KB, and Guile still reaches 5700 requests per second on this one core, serving 280 megabytes per second of... well, of my blather, really. But it's a powerful blather-pipe!
related & future work
Here's a similarly flawed test from a year ago of static servers, serving small static files over localhost. Flawed, but it's a lot like this "hello world" test in semantics. We see that nginx gets up to about 20K requests per second, per core. It also does so with a flat memory profile, which is nice.
Guile's bundled web server is currently single-threaded and blocking, which does not make it a good frontend server. There's room for a project to build a proper web server on top of Guile, I think, but I probably won't do it myself. In the meantime though, I do want to offer the possibility for the built-in web server to be multithreaded, with some number of I/O threads and some more limited number of compute threads. I've been testing out some code in that direction -- in fact, this server is running that code -- but as yet Guile's synchronization primitives have too much overhead for it to be a real win. There's more runtime and compiler work to do here.
As far as web servers written in safe languages, it would be remiss to not mention Warp, a Haskell web server. Again, their tests effectively utilize multiple cores, but it seems that 20K per core is the standard.
Unlike Haskell, Guile lacks a proper event manager. I'm not sure whether to work on such a thing; Havoc seems to think it's necessary, and who am I to argue.
Finally, I mention a benchmark of python WSGI servers from a couple years ago. (Is March the month of benchmarks?) The python performance is notably worse; hopefully PyPy has improved things in the meantime. On the other hand, GEvent's use of greenlets is really nice, and makes me envious.
conclusions
Hey, you read the thing! Congratulations to you! Good thing you didn't just skip down to the end :)
If I have a message to send, it's this: that you should consider using Guile to be perfectly acceptable for implementing dynamic web applications with high performance requirements.
It's a modest point, I know. There are all kinds of trade-offs here, but hey, Guile is plucky and still a little bit shy, but would love it if you to ask it to the hack.
If it works for you, boast about it to your colleagues! And if it doesn't, let us know, over at the usual places (guile-user@gnu.org, and #guile on freenode). Happy hacking!
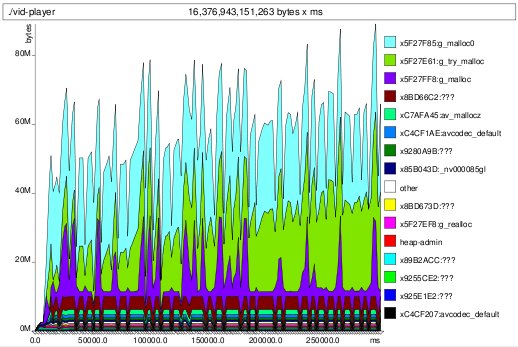 houston, we have a leak
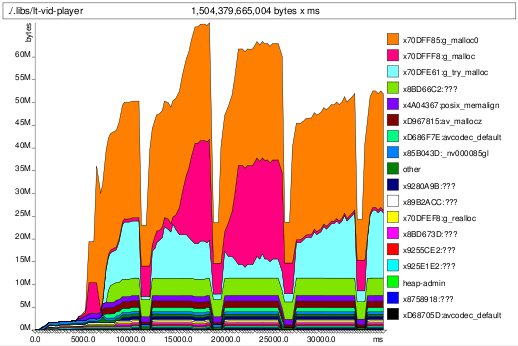 bucket effect -- watch the cyan trough fill up
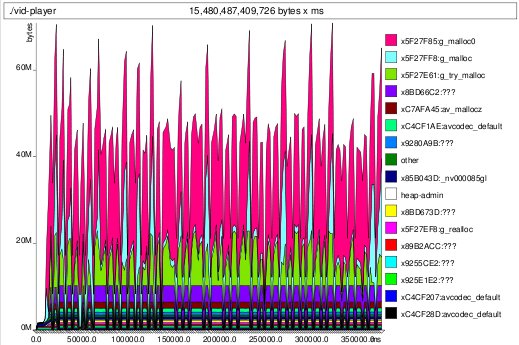 memleak fixed