tracepoints: gnarly but worth it
Hey all, quick post today to mention that I added tracing support to the Whippet GC library. If the support library for LTTng is available when Whippet is compiled, Whippet embedders can visualize the GC process. Like this!
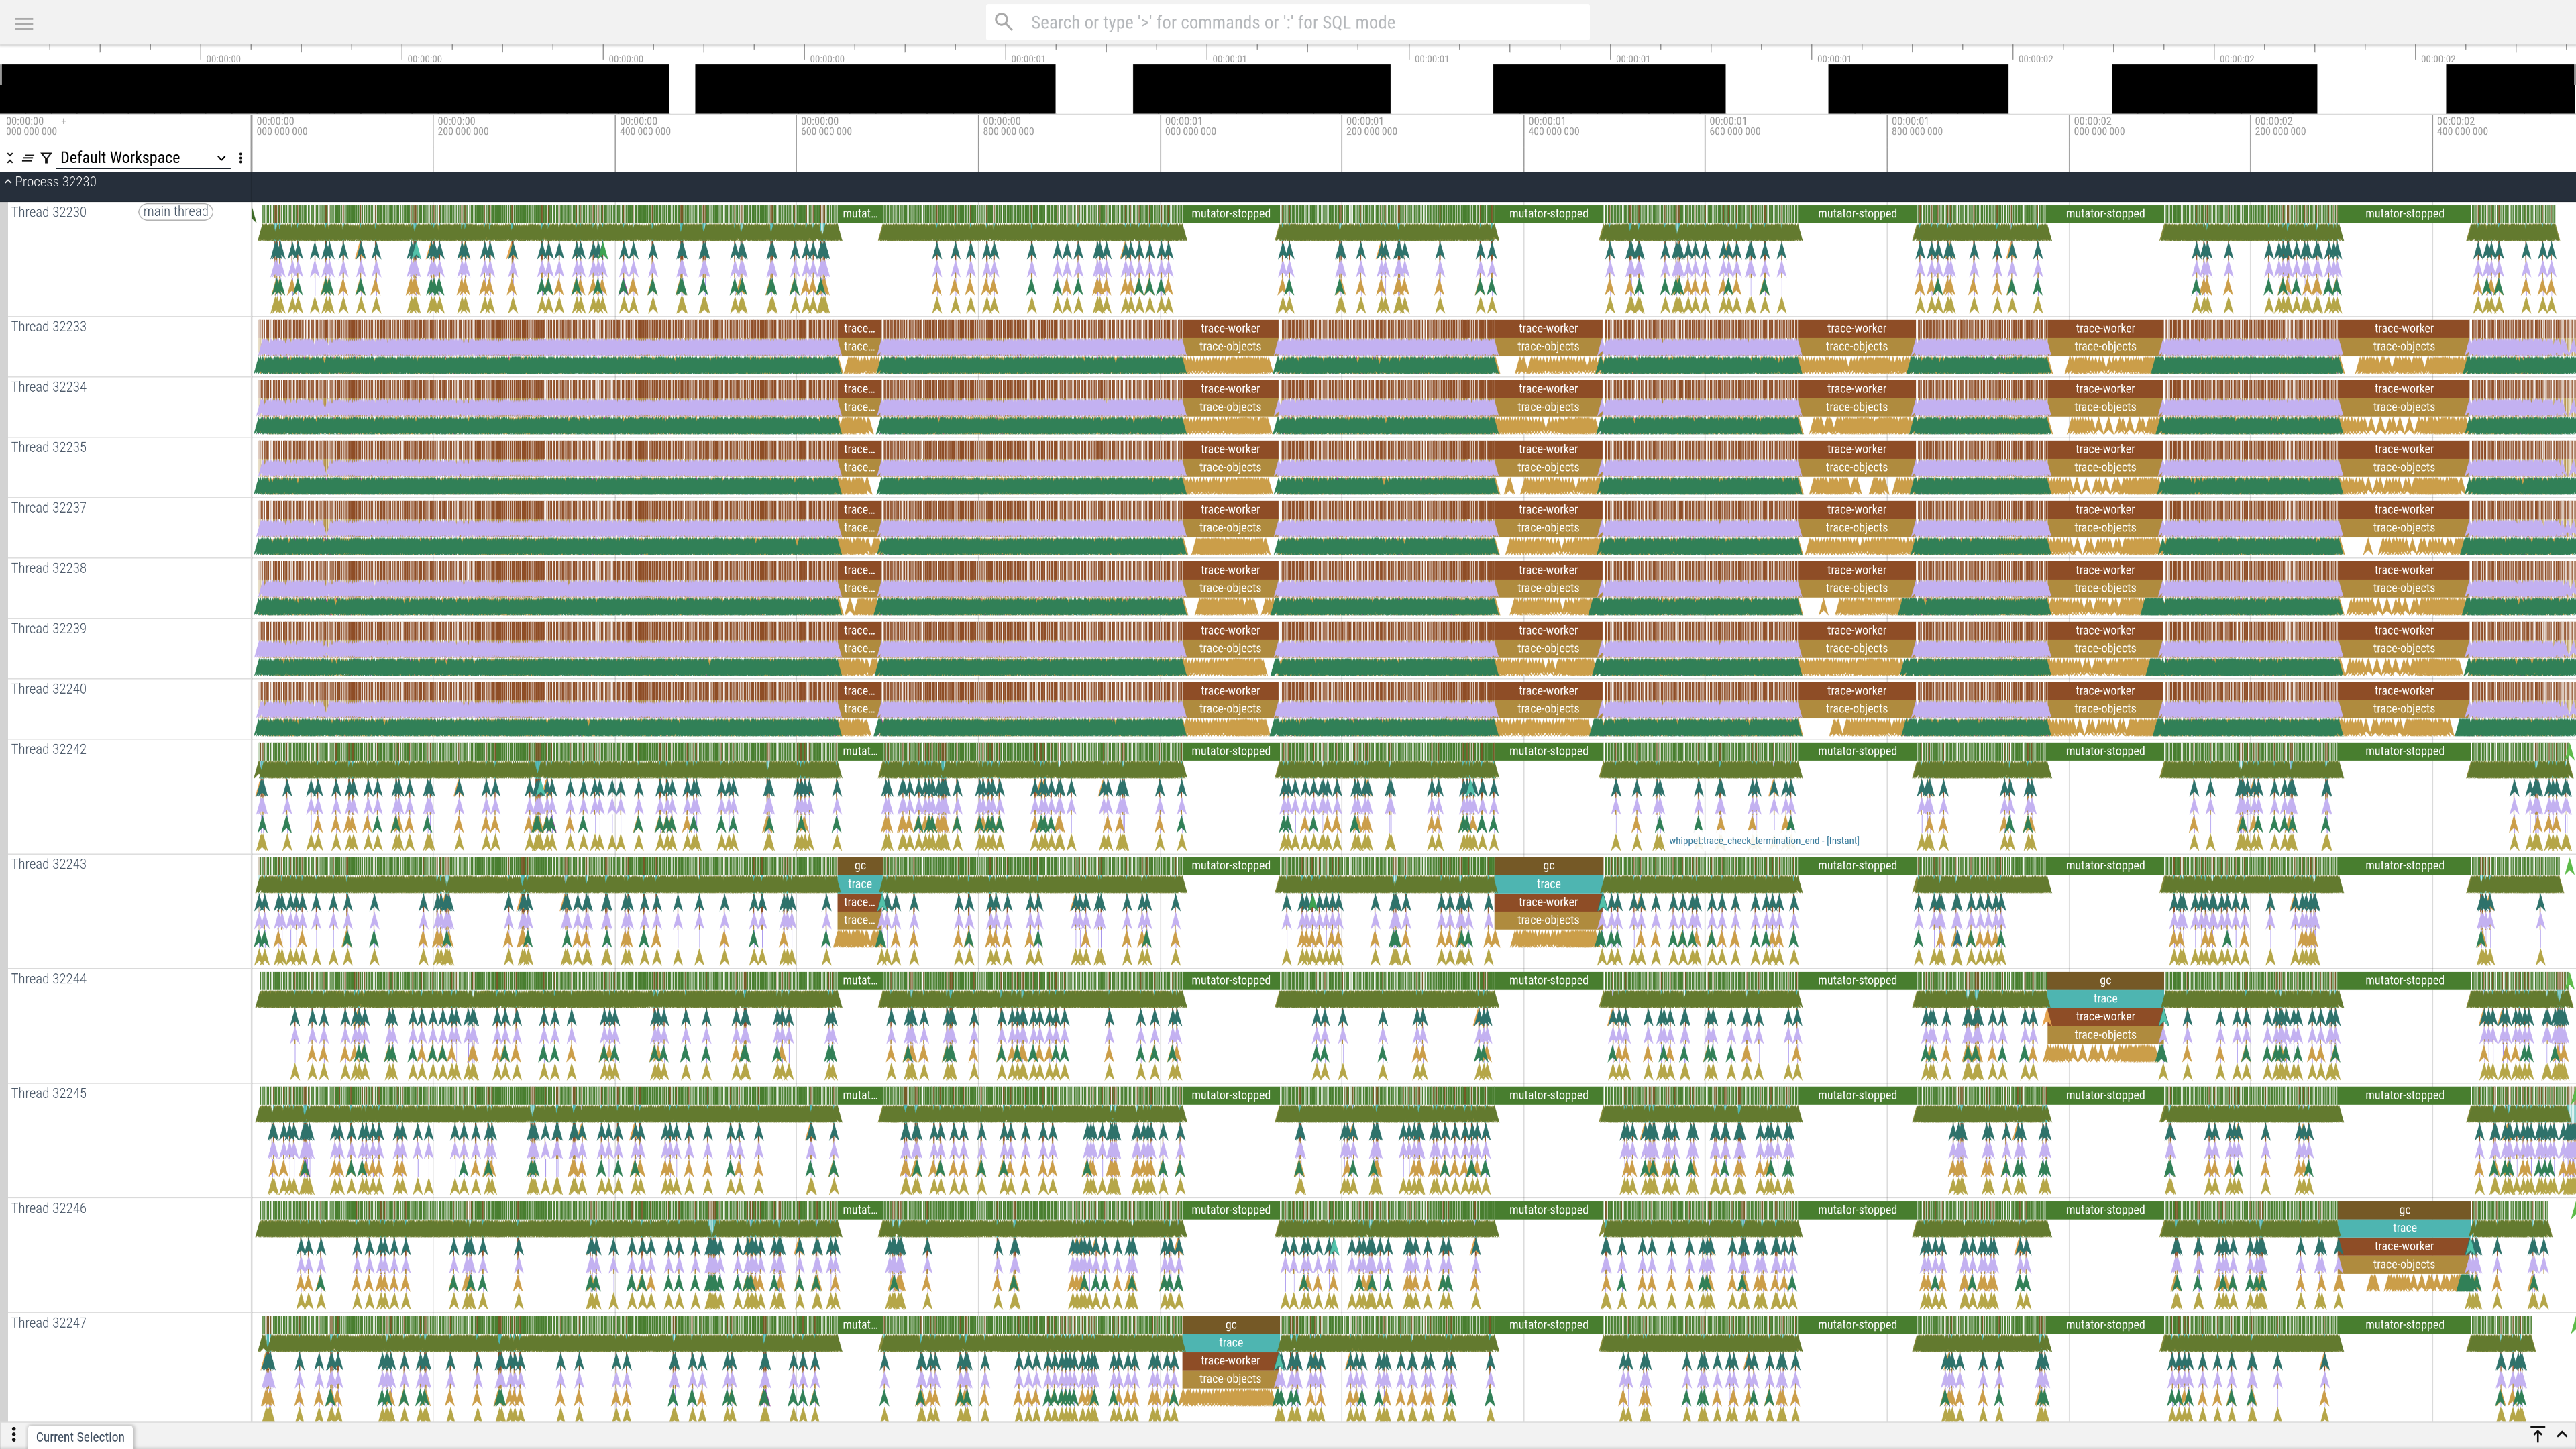
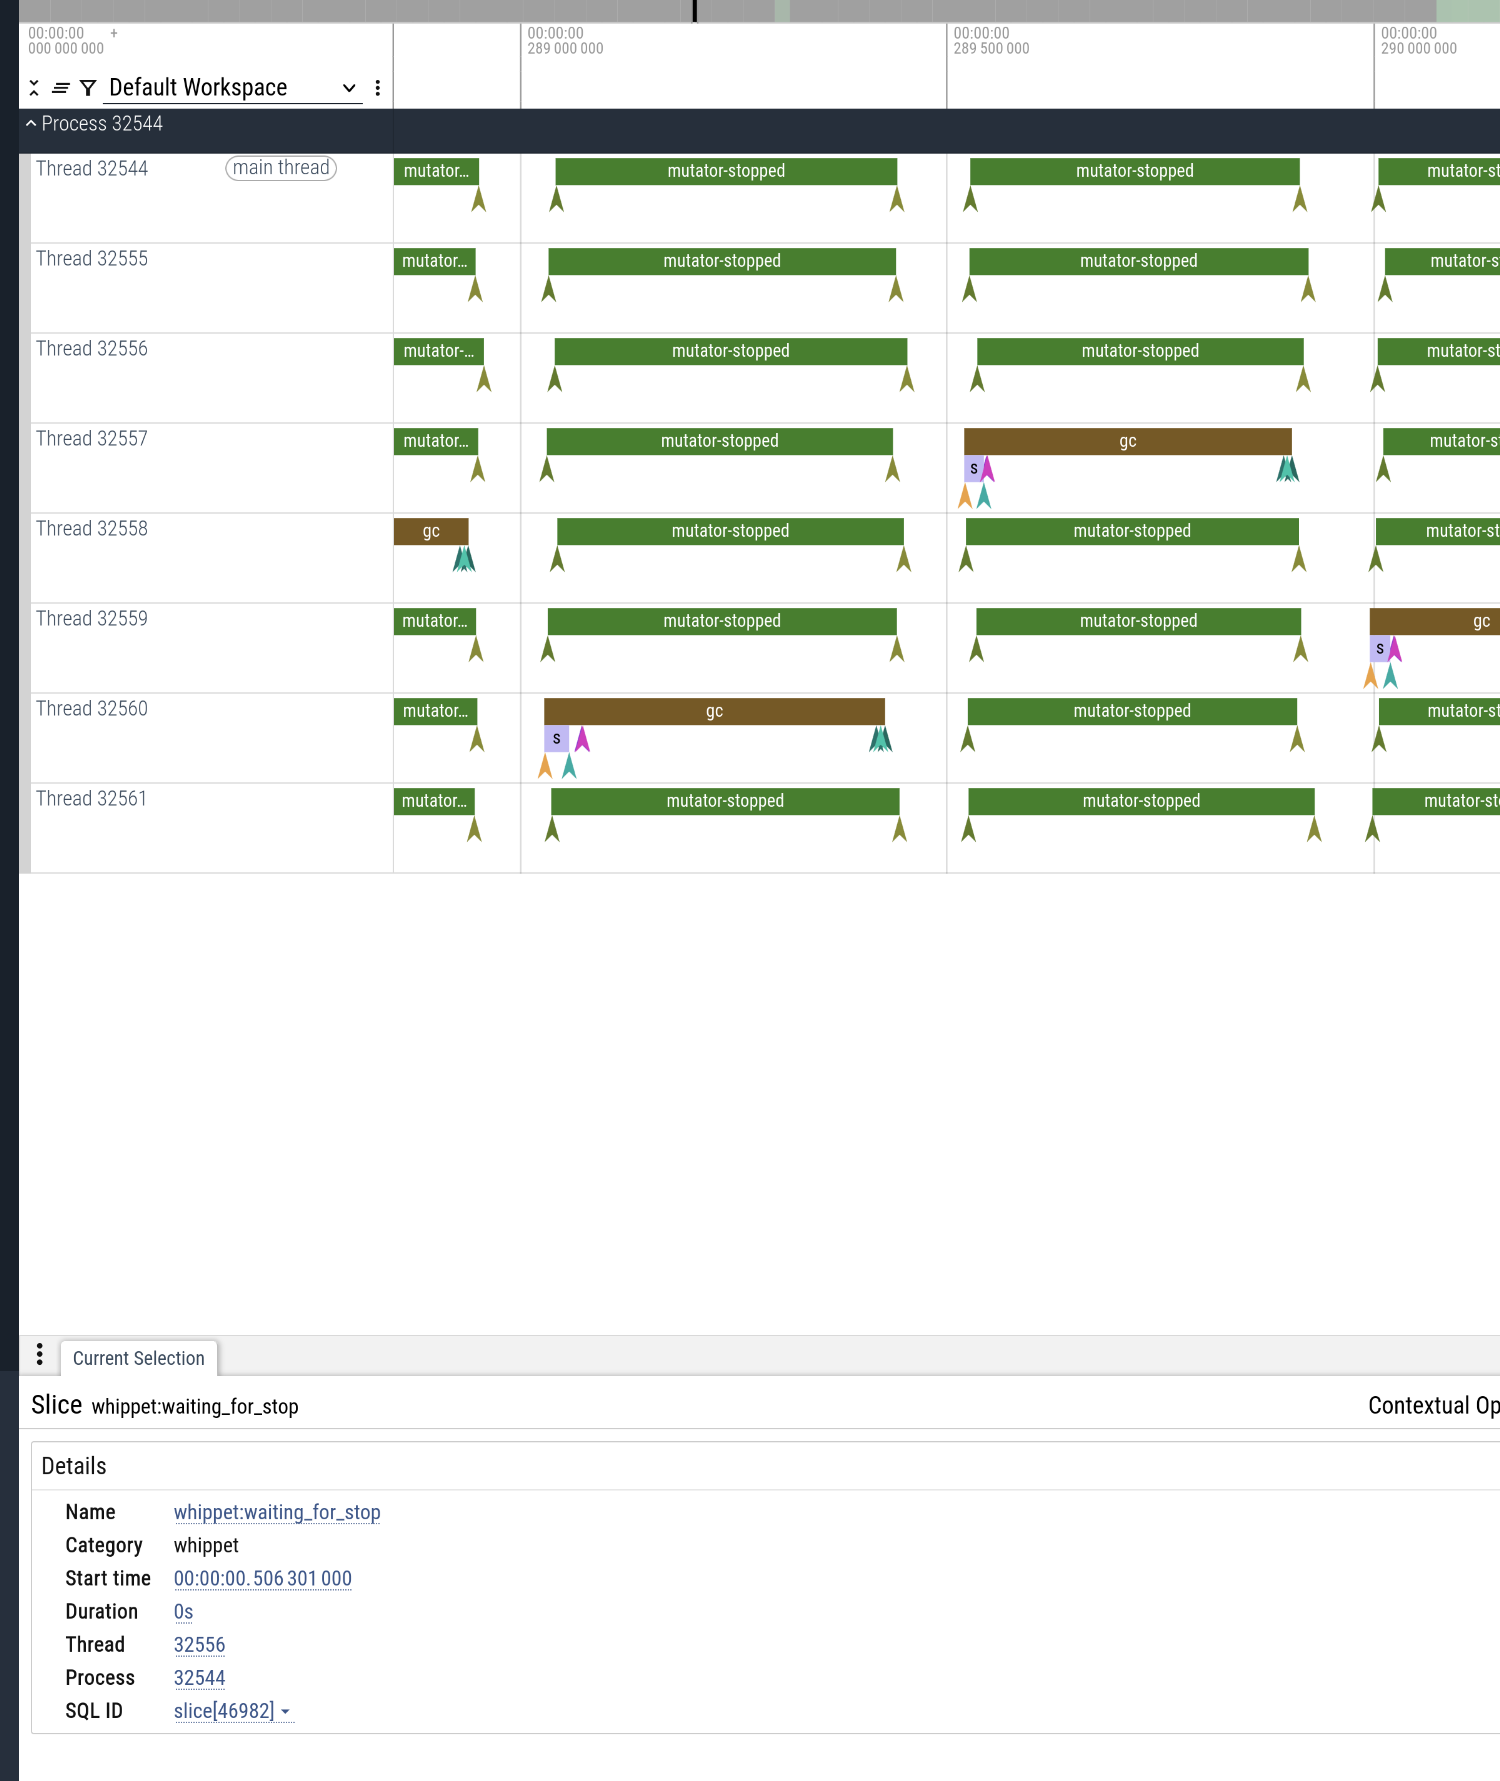
Click above for a full-scale screenshot of the Perfetto trace explorer processing the nboyer microbenchmark with the parallel copying collector on a 2.5x heap. Of course no image will have all the information; the nice thing about trace visualizers like is that you can zoom in to sub-microsecond spans to see exactly what is happening, have nice mouseovers and clicky-clickies. Fun times!
on adding tracepoints
Adding tracepoints to a library is not too hard in the end. You need to pull in the lttng-ust library, which has a pkg-config file. You need to declare your tracepoints in one of your header files. Then you have a minimal C file that includes the header, to generate the code needed to emit tracepoints.
Annoyingly, this header file you write needs to be in one of the -I directories; it can’t be just in the the source directory, because lttng includes it seven times (!!) using computed includes (!!!) and because the LTTng file header that does all the computed including isn’t in your directory, GCC won’t find it. It’s pretty ugly. Ugliest part, I would say. But, grit your teeth, because it’s worth it.
Finally you pepper your source with tracepoints, which probably you wrap in some macro so that you don’t have to require LTTng, and so you can switch to other tracepoint libraries, and so on.
using the thing
I wrote up a little guide for Whippet users about how to actually get traces. It’s not as easy as perf record, which I think is an error. Another ugly point. Buck up, though, you are so close to graphs!
By which I mean, so close to having to write a Python script to make graphs! Because LTTng writes its logs in so-called Common Trace Format, which as you might guess is not very common. I have a colleague who swears by it, that for him it is the lowest-overhead system, and indeed in my case it has no measurable overhead when trace data is not being collected, but his group uses custom scripts to convert the CTF data that he collects to... GTKWave (?!?!?!!).
In my case I wanted to use Perfetto’s UI, so I found a script to convert from CTF to the JSON-based tracing format that Chrome profiling used to use. But, it uses an old version of Babeltrace that wasn’t available on my system, so I had to write a new script (!!?!?!?!!), probably the most Python I have written in the last 20 years.
is it worth it?
Yes. God I love blinkenlights. As long as it’s low-maintenance going forward, I am satisfied with the tradeoffs. Even the fact that I had to write a script to process the logs isn’t so bad, because it let me get nice nested events, which most stock tracing tools don’t allow you to do.
I fixed a small performance bug because of it – a worker thread was spinning waiting for a pool to terminate instead of helping out. A win, and one that never would have shown up on a sampling profiler too. I suspect that as I add more tracepoints, more bugs will be found and fixed.
fin
I think the only thing that would be better is if tracepoints were a part of Linux system ABIs – that there would be header files to emit tracepoint metadata in all binaries, that you wouldn’t have to link to any library, and the actual tracing tools would be intermediated by that ABI in such a way that you wouldn’t depend on those tools at build-time or distribution-time. But until then, I will take what I can get. Happy tracing!
One response
Comments are closed.
I think the only thing that would be better is if tracepoints were a part of Linux system ABIs
Not really a spec’ed Linux ABI but USDT trace points are written into ELF notes of binaries and can be traced using perf. My system already contains quite a bunch of them: perf list sdt | grep postgresql | wc -l => 57
Good quick introduction: https://www.brendangregg.com/perf.html#USDT