fibs, lies, and benchmarks
Friends, consider the recursive Fibonacci function, expressed most lovelily in Haskell:
fib 0 = 0
fib 1 = 1
fib n = fib (n-1) + fib (n-2)
Computing elements of the Fibonacci sequence ("Fibonacci numbers") is a common microbenchmark. Microbenchmarks are like a Suzuki exercises for learning violin: not written to be good tunes (good programs), but rather to help you improve a skill.
The fib microbenchmark teaches language implementors to improve recursive function call performance.
I'm writing this article because after adding native code generation to Guile, I wanted to check how Guile was doing relative to other language implementations. The results are mixed. We can start with the most favorable of the comparisons: Guile present versus Guile of the past.
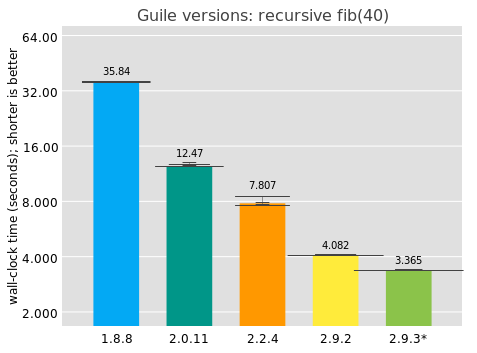
I collected these numbers on my i7-7500U CPU @ 2.70GHz 2-core laptop, with no particular performance tuning, running each benchmark 10 times, waiting 2 seconds between measurements. The bar value indicates the median elapsed time, and above each bar is an overlayed histogram of all results for that scenario. Note that the y axis is on a log scale. The 2.9.3* version corresponds to unreleased Guile from git.
Good news: Guile has been getting significantly faster over time! Over decades, true, but I'm pleased.
where are we? static edition
How good are Guile's numbers on an absolute level? It's hard to say because there's no absolute performance oracle out there. However there are relative performance oracles, so we can try out perhaps some other language implementations.
First up would be the industrial C compilers, GCC and LLVM. We can throw in a few more "static" language implementations as well: compilers that completely translate to machine code ahead-of-time, with no type feedback, and a minimal run-time.
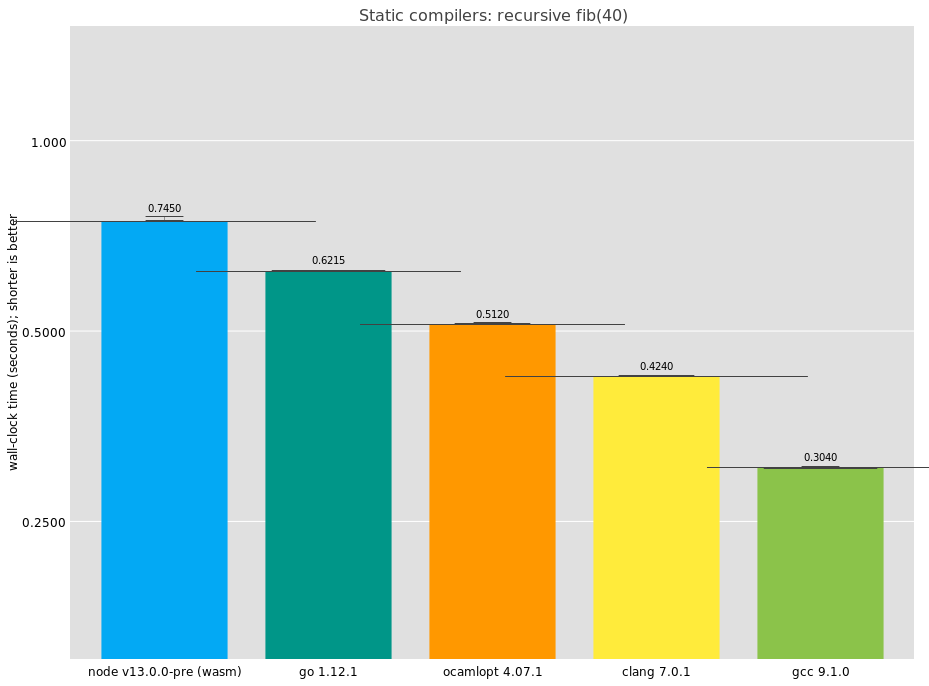
Here we see that GCC is doing best on this benchmark, completing in an impressive 0.304 seconds. It's interesting that the result differs so much from clang. I had a look at the disassembly for GCC and I see:
fib:
    push   %r12
    mov    %rdi,%rax
    push   %rbp
    mov    %rdi,%rbp
    push   %rbx
    cmp    $0x1,%rdi
    jle    finish
    mov    %rdi,%rbx
    xor    %r12d,%r12d
again:
    lea    -0x1(%rbx),%rdi
    sub    $0x2,%rbx
    callq  fib
    add    %rax,%r12
    cmp    $0x1,%rbx
    jg     again
    and    $0x1,%ebp
    lea    0x0(%rbp,%r12,1),%rax
finish:
    pop    %rbx
    pop    %rbp
    pop    %r12
    retq
It's not quite straightforward; what's the loop there for? It turns out that GCC inlines one of the recursive calls to fib. The microbenchmark is no longer measuring call performance, because GCC managed to reduce the number of calls. If I had to guess, I would say this optimization doesn't have a wide applicability and is just to game benchmarks. In that case, well played, GCC, well played.
LLVM's compiler (clang) looks more like what we'd expect:
fib:
   push   %r14
   push   %rbx
   push   %rax
   mov    %rdi,%rbx
   cmp    $0x2,%rdi
   jge    recurse
   mov    %rbx,%rax
   add    $0x8,%rsp
   pop    %rbx
   pop    %r14
   retq
recurse:
   lea    -0x1(%rbx),%rdi
   callq  fib
   mov    %rax,%r14
   add    $0xfffffffffffffffe,%rbx
   mov    %rbx,%rdi
   callq  fib
   add    %r14,%rax
   add    $0x8,%rsp
   pop    %rbx
   pop    %r14
   retq
I bolded the two recursive calls.
Incidentally, the fib as implemented by GCC and LLVM isn't quite the same program as Guile's version. If the result gets too big, GCC and LLVM will overflow, whereas in Guile we overflow into a bignum. Also in C, it's possible to "smash the stack" if you recurse too much; compilers and run-times attempt to mitigate this danger but it's not completely gone. In Guile you can recurse however much you want. Finally in Guile you can interrupt the process if you like; the compiled code is instrumented with safe-points that can be used to run profiling hooks, debugging, and so on. Needless to say, this is not part of C's mission.
Some of these additional features can be implemented with no significant performance cost (e.g., via guard pages). But it's fair to expect that they have some amount of overhead. More on that later.
The other compilers are OCaml's ocamlopt, coming in with a very respectable result; Go, also doing well; and V8 WebAssembly via Node. As you know, you can compile C to WebAssembly, and then V8 will compile that to machine code. In practice it's just as static as any other compiler, but the generated assembly is a bit more involved:
fib_tramp:
    jmp    fib

fib:
    push   %rbp
    mov    %rsp,%rbp
    pushq  $0xa
    push   %rsi
    sub    $0x10,%rsp
    mov    %rsi,%rbx
    mov    0x2f(%rbx),%rdx
    mov    %rax,-0x18(%rbp)
    cmp    %rsp,(%rdx)
    jae    stack_check
post_stack_check:
    cmp    $0x2,%eax
    jl     return_n
    lea    -0x2(%rax),%edx
    mov    %rbx,%rsi
    mov    %rax,%r10
    mov    %rdx,%rax
    mov    %r10,%rdx
    callq  fib_tramp
    mov    -0x18(%rbp),%rbx
    sub    $0x1,%ebx
    mov    %rax,-0x20(%rbp)
    mov    -0x10(%rbp),%rsi
    mov    %rax,%r10
    mov    %rbx,%rax
    mov    %r10,%rbx
    callq  fib_tramp
return:
    mov    -0x20(%rbp),%rbx
    add    %ebx,%eax
    mov    %rbp,%rsp
    pop    %rbp
    retq
return_n:
    jmp    return
stack_check:
    callq  WasmStackGuard
    mov    -0x10(%rbp),%rbx
    mov    -0x18(%rbp),%rax
    jmp    post_stack_check
Apparently fib compiles to a function of two arguments, the first passed in rsi, and the second in rax. (V8 uses a custom calling convention for its compiled WebAssembly.) The first synthesized argument is a handle onto run-time data structures for the current thread or isolate, and in the function prelude there's a check to see that the function has enough stack. V8 uses these stack checks also to handle interrupts, for when a web page is stuck in JavaScript.
Otherwise, it's a more or less normal function, with a bit more register/stack traffic than would be strictly needed, but pretty good.
do optimizations matter?
You've heard of Moore's Law -- though it doesn't apply any more, it roughly translated into hardware doubling in speed every 18 months. (Yes, I know it wasn't precisely that.) There is a corresponding rule of thumb for compiler land, Proebsting's Law: compiler optimizations make software twice as fast every 18 years. Zow!
The previous results with GCC and LLVM were with optimizations enabled (-O3). One way to measure Proebsting's Law would be to compare the results with -O0. Obviously in this case the program is small and we aren't expecting much work out of the optimizer, but it's interesting to see anyway:
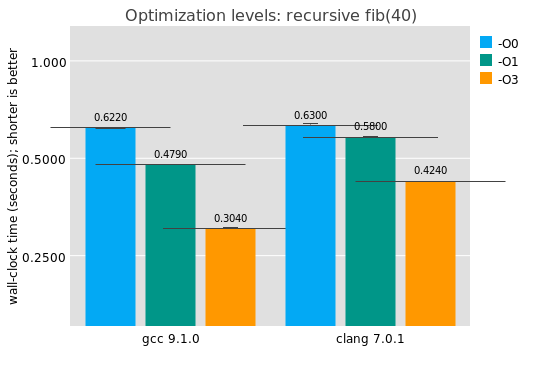
Answer: optimizations don't matter much for this benchark. This investigation does give a good baseline for compilers from high-level languages, like Guile: in the absence of clever trickery like the recursive inlining thing GCC does and in the absence of industrial-strength instruction selection, what's a good baseline target for a compiler? Here we see for this benchmark that it's somewhere between 420 and 620 milliseconds or so. Go gets there, and OCaml does even better.
how is time being spent, anyway?
Might we expect V8/WebAssembly to get there soon enough, or is the stack check that costly? How much time does one stack check take anyway? For that we'd have to determine the number of recursive calls for a given invocation.
Friends, it's not entirely clear to me why this is, but I instrumented a copy of fib, and I found that the number of calls in fib(n) was a more or less constant factor of the result of calling fib. That ratio converges to twice the golden ratio, which means that since fib(n+1) ~= φ * fib(n), then the number of calls in fib(n) is approximately 2 * fib(n+1). I scratched my head for a bit as to why this is and I gave up; the Lord works in mysterious ways.
Anyway for fib(40), that means that there are around 3.31e8 calls, absent GCC shenanigans. So that would indicate that each call for clang takes around 1.27 ns, which at turbo-boost speeds on this machine is 4.44 cycles. At maximum throughput (4 IPC), that would indicate 17.8 instructions per call, and indeed on the n > 2 path I count 17 instructions.
For WebAssembly I calculate 2.25 nanoseconds per call, or 7.9 cycles, or 31.5 (fused) instructions at max IPC. And indeed counting the extra jumps in the trampoline, I get 33 cycles on the recursive path. I count 4 instructions for the stack check itself, one to save the current isolate, and two to shuffle the current isolate into place for the recursive calls. But, compared to clang, V8 puts 6 words on the stack per call, as opposed to only 4 for LLVM. I think with better interprocedural register allocation for the isolate (i.e.: reserve a register for it), V8 could get a nice boost for call-heavy workloads.
where are we? dynamic edition
Guile doesn't aim to replace C; it's different. It has garbage collection, an integrated debugger, and a compiler that's available at run-time, it is dynamically typed. It's perhaps more fair to compare to languages that have some of these characteristics, so I ran these tests on versions of recursive fib written in a number of languages. Note that all of the numbers in this post include start-up time.
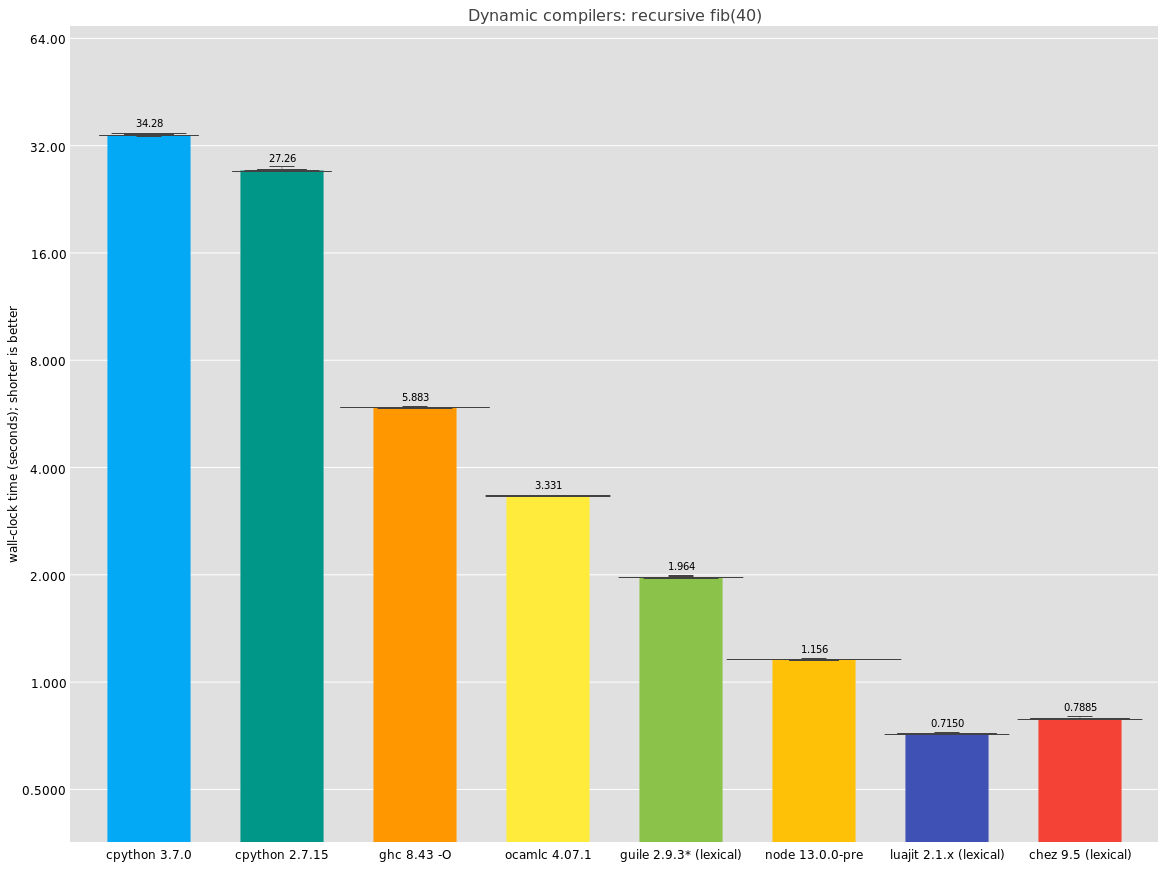
Here, the ocamlc line is the same as before, but using the bytecode compiler instead of the native compiler. It's a bit of an odd thing to include but it performs so well I just had to include it.
I think the real takeaway here is that Chez Scheme has fantastic performance. I have not been able to see the disassembly -- does it do the trick like GCC does? -- but the numbers are great, and I can see why Racket decided to rebase its implementation on top of it.
Interestingly, as far as I understand, Chez implements stack checks in the straightfoward way (an inline test-and-branch), not with a guard page, and instead of using the stack check as a generic ability to interrupt a computation in a timely manner as V8 does, Chez emits a separate interrupt check. I would like to be able to see Chez's disassembly but haven't gotten around to figuring out how yet.
Since I originally published this article, I added a LuaJIT entry as well. As you can see, LuaJIT performs as well as Chez in this benchmark.
Haskell's call performance is surprisingly bad here, beaten even by OCaml's bytecode compiler; is this the cost of laziness, or just a lacuna of the implementation? I do not know. I do know I have this mental image that Haskell is a good compiler but apparently if that's the standard, so is Guile :)
Finally, in this comparison section, I was not surprised by cpython's relatively poor performance; we know cpython is not fast. I think though that it just goes to show how little these microbenchmarks are worth when it comes to user experience; like many of you I use plenty of Python programs in my daily work and don't find them slow at all. Think of micro-benchmarks like x-ray diffraction; they can reveal the hidden substructure of DNA but they say nothing at all about the organism.
where to now?
Perhaps you noted that in the last graph, the Guile and Chez lines were labelled "(lexical)". That's because instead of running this program:
(define (fib n)
  (if (< n 2)
      n
      (+ (fib (- n 1)) (fib (- n 2)))))
They were running this, instead:
(define (fib n)
  (define (fib* n)
    (if (< n 2)
        n
        (+ (fib* (- n 1)) (fib* (- n 2)))))
  (fib* n))
The thing is, historically, Scheme programs have treated top-level definitions as being mutable. This is because you don't know the extent of the top-level scope -- there could always be someone else who comes and adds a new definition of fib, effectively mutating the existing definition in place.
This practice has its uses. It's useful to be able to go in to a long-running system and change a definition to fix a bug or add a feature. It's also a useful way of developing programs, to incrementally build the program bit by bit.
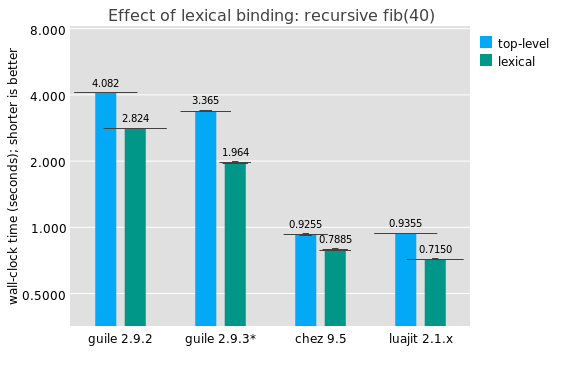
But, I would say that as someone who as written and maintained a lot of Scheme code, it's not a normal occurence to mutate a top-level binding on purpose, and it has a significant performance impact. If the compiler knows the target to a call, that unlocks a number of important optimizations: type check elision on the callee, more optimal closure representation, smaller stack frames, possible contification (turning calls into jumps), argument and return value count elision, representation specialization, and so on.
This overhead is especially egregious for calls inside modules. Scheme-the-language only gained modules relatively recently -- relative to the history of scheme -- and one of the aspects of modules is precisely to allow reasoning about top-level module-level bindings. This is why running Chez Scheme with the --program option is generally faster than --script (which I used for all of these tests): it opts in to the "newer" specification of what a top-level binding is.
In Guile we would probably like to move towards a more static way of treating top-level bindings, at least those within a single compilation unit. But we haven't done so yet. It's probably the most important single optimization we can make over the near term, though.
As an aside, it seems that LuaJIT also shows a similar performance differential for local function fib(n) versus just plain function fib(n).
It's true though that even absent lexical optimizations, top-level calls can be made more efficient in Guile. I am not sure if we can reach Chez with the current setup of having a template JIT, because we need two return addresses: one virtual (for bytecode) and one "native" (for JIT code). Register allocation is also something to improve but it turns out to not be so important for fib, as there are few live values and they need to spill for the recursive call. But, we can avoid some of the indirection on the call, probably using an inline cache associated with the callee; Chez has had this optimization since 1984!
what guile learned from fib
This exercise has been useful to speed up Guile's procedure calls, as you can see for the difference between the latest Guile 2.9.2 release and what hasn't been released yet (2.9.3).
To decide what improvements to make, I extracted the assembly that Guile generated for fib to a standalone file, and tweaked it in a number of ways to determine what the potential impact of different scenarios was. Some of the detritus from this investigation is here.
There were three big performance improvements. One was to avoid eagerly initializing the slots in a function's stack frame; this took a surprising amount of run-time. Fortunately the rest of the toolchain like the local variable inspector was already ready for this change.
Another thing that became clear from this investigation was that our stack frames were too large; there was too much memory traffic. I was able to improve this in the lexical-call by adding an optimization to elide useless closure bindings. Usually in Guile when you call a procedure, you pass the callee as the 0th parameter, then the arguments. This is so the procedure has access to its closure. For some "well-known" procedures -- procedures whose callers can be enumerated -- we optimize to pass a specialized representation of the closure instead ("closure optimization"). But for well-known procedures with no free variables, there's no closure, so we were just passing a throwaway value (#f). An unhappy combination of Guile's current calling convention being stack-based and a strange outcome from the slot allocator meant that frames were a couple words too big. Changing to allow a custom calling convention in this case sped up fib considerably.
Finally, and also significantly, Guile's JIT code generation used to manually handle calls and returns via manual stack management and indirect jumps, instead of using the platform calling convention and the C stack. This is to allow unlimited stack growth. However, it turns out that the indirect jumps at return sites were stalling the pipeline. Instead we switched to use call/return but keep our manual stack management; this allows the CPU to use its return address stack to predict return targets, speeding up code.
et voilà
Well, long article! Thanks for reading. There's more to do but I need to hit the publish button and pop this off my stack. Until next time, happy hacking!
8 responses
Comments are closed.
> I think the real takeaway here is that Chez Scheme has fantastic performance. I have not been able to see the disassembly
You can show the disassembly in chez with the #%$assembly-output parameter. You can set it to #t, #f, or a textual output port.
#t - standard out
#f - out
else - wherever the port goes
#f should say "off" not "out". oops
On the "(lexical)" trick: Could you use a ridiculously optimistic 'guard'? Like, when you first compile a global call, use the target address directly (without checks) and add some bookkeeping data to the global itself; then, when the global gets updated, immediately taint/block that code so that it may be recompiled.
Making it support nested access (like Math.sin in JS) would be trickier.
Hopefully, updating global function references is rare enough that it could be a small win for real-world code (and some microbenchmarks).
Does guile assume that the arithmetic operations in fib are the standard, built-in functions?
It would interesting to see results from CL/sbcl :)
> Friends, it's not entirely clear to me why this is, but I instrumented a copy of fib, and I found that the number of calls in fib(n) was a more or less constant factor of the result of calling fib … the number of calls in fib(n) is approximately 2 * fib(n+1).
I wasn't sure if this was a cute joke or a real question :) If the latter, this is why.
- The number of calls made when you call fib(0) or fib(1) is just 1, as both return immediately.
- Now for any n > 1, the number of calls made when you call fib(n) (let's call that C(n)) is as follows:
1 [the call to fib(n) itself]
+ C(n-1) [the cost of calling fib(n-1)]
+ C(n-2) [the cost of calling fib(n-2)]
Hence the recursion equation is
C(n) = 1 + C(n-1) + C(n-2)
Let's add 1 to each side:
1 + C(n) = (1 + C(n-1)) + (1 + C(n-2))
Now let's call the left side C'(n): C'(n) = 1 + C(n). What do we get?
C'(n) = C'(n-1) + C'(n-2)
What about the base cases?
C'(0) = 1 + 1 = 2 = 2 * fib(1)
C'(1) = 1 + 1 = 2 = 2 * fib(2)
Conjecture: C'(n) = 2 * fib(n + 1)
Proof:
* This is true for 0 and 1, as shown above
* For a given n, if
- C'(n-1) = 2 * fib(n) and
- C'(n-2) = 2 * fib(n-1), then
C'(n) = C'(n-1) + C'(n-2)
= 2 * fib(n) + 2 * fib(n-1)
= 2 * fib(n+1) 🞎
Now we can substitute: C(n) = C'(n) - 1 = 2 * fib(n+1) - 1
Tadaa.
@tumdum
In SBCL (version 1.3.14.debian), it takes 3.3 s to compute `(fib 40)'.
,----
| (defun fib (x)
| (if (< x 2)
| x
| (+ (fib (- x 1)) (fib (- x 2)))))
|
| (let ((*trace-output* *standard-output*))
| (time (fib 40)))
`----
,----
| Evaluation took:
| 3.287 seconds of real time
| 3.288000 seconds of total run time (3.288000 user, 0.000000 system)
| 100.03% CPU
| 7,542,852,767 processor cycles
| 33,184 bytes consed
|
`----
Using a "lexical" definition, it takes 3 s to compute `(fib 40)', so it
helps a little.
,----
| (defun fib (x)
| (labels ((fib (x)
| (if (< x 2)
| x
| (+ (fib (- x 1)) (fib (- x 2))))))
| (fib x)))
|
| (let ((*trace-output* *standard-output*))
| (time (fib 40)))
`----
,----
| Evaluation took:
| 2.960 seconds of real time
| 2.964000 seconds of total run time (2.964000 user, 0.000000 system)
| 100.14% CPU
| 6,791,278,869 processor cycles
| 0 bytes consed
|
`----
Note that I have (declaim (optimize (speed 0) (debug 2) safety)) inside
my `.sbclrc'. If we are willing to /cheat/ by using type and
optimization declarations, it takes 0.9 s to compute `(fib 40)'. Using
a lexical definition doesn't change the elapsed time.
,----
| (defun fib (x)
| (declare (optimize speed (safety 0) (debug 0))
| (type fixnum x))
| (the fixnum
| (if (< x 2)
| x
| (+ (fib (- x 1))
| (fib (- x 2))))))
|
| (let ((*trace-output* *standard-output*))
| (time (fib 40)))
`----
,----
| Evaluation took:
| 0.876 seconds of real time
| 0.876000 seconds of total run time (0.876000 user, 0.000000 system)
| 100.00% CPU
| 2,010,534,655 processor cycles
| 0 bytes consed
|
`----
Bah, so many spam comments: behold the downside of writing your own blog software.
I'd say that gcc's recursive inlining is pretty much the same as the standard optimization of loop unrolling: of course, both have to be bounded. No one knows better than the Scheme community the intimate intertwining of recursion and iteration.