catching memory leaks with valgrind's massif
One of my first tasks at Oblong was to migrate their code for playing video from some very tricky, threaded ffmpeg + portaudio code to using GStreamer. The playback interface is fairly standard, but thorough: seeks to time, segment seeks, variable speed and reverse playback, frame stepping, etc. There were some twists: we do colorspace conversion on the GPU, and there's a strange concept of "masks", which is useful for operating on rotoscoped video, and there's integration with the GL main loop.
But anyway, I felt finished with all of that a while ago. The only problem was a lingering memory leak, especially egregious in the context of the art installation, which has yet to switch to my code.
So it was with a queasy, helpless feeling that I sat down and tried to systematize the problem, come up with a test case, and see if I could track down where the leak was. I tried code inspection at first, and I proved my code correct. (Foreshadowing, that.) I at least narrowed down the situations under which it occured. I then despaired for a while, before I hit on the way to make memory leak detection fun: turn it into a tools problem. Now instead of finding the leak, all I needed to do was to find the leak detector!
So I checked out valgrind from CVS; it crashed on me. Then I decided to see if libc had anything to offer me; indeed it does, mtrace. But alack, deadlocks. I even went so far as to include mtrace in my code, and applied Jambor's patch from the bug report on my sources, but lost because the ELF symbol resolution is intertwingled with libc's build system.
So back to valgrind, this time the 3.2.3 version packaged with Fedora, and lo and behold, exhibit A:
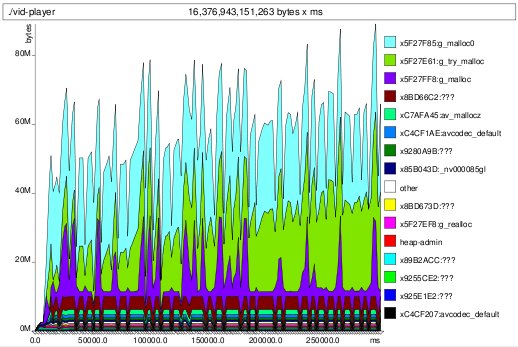
 houston, we have a leak
My test is adding a video, waiting a while, removing the video, waiting again, then repeating. You can see the obvious video-playing versus video-removed phases.
Fortunately, you can also see the leak, and where it is: in the green part, corresponding to something that's calling g_try_malloc. This was comforting to find. It could have been something involving GL contexts or whatnot, and I'm using the babymunching nvidia drivers. So g_try_malloc was where it was coming from. But what was calling g_try_malloc?
For that, you have to dive into the textual output produced by massif. And sure enough, following things back far enough, you find that it is a GStreamer video buffer:
Context accounted for  7.2% of measured spacetime
  0x5F27E60: g_try_malloc (gmem.c:196)
  0x52E1487: gst_buffer_try_new_and_alloc (gstbuffer.c:359)
  0x530367B: gst_pad_alloc_buffer_full (gstpad.c:2702)
  0x53039FA: gst_pad_alloc_buffer (gstpad.c:2823)
  0xB9C11BF: gst_queue_bufferalloc (gstqueue.c:502)
  0x53034C0: gst_pad_alloc_buffer_full (gstpad.c:2668)
  0x53039E6: gst_pad_alloc_buffer_and_set_caps (gstpad.c:2850)
  0xBBECB4F: gst_base_transform_buffer_alloc (gstbasetransform.c:1112)
  0x53034C0: gst_pad_alloc_buffer_full (gstpad.c:2668)
  0x53039E6: gst_pad_alloc_buffer_and_set_caps (gstpad.c:2850)
  0xBBECB4F: gst_base_transform_buffer_alloc (gstbasetransform.c:1112)
  0x53034C0: gst_pad_alloc_buffer_full (gstpad.c:2668)
  0x53039FA: gst_pad_alloc_buffer (gstpad.c:2823)
  0x52F6C68: gst_proxy_pad_do_bufferalloc (gstghostpad.c:182)
  0x53034C0: gst_pad_alloc_buffer_full (gstpad.c:2668)
  0x53039E6: gst_pad_alloc_buffer_and_set_caps (gstpad.c:2850)
  0xC452722: alloc_output_buffer (gstffmpegdec.c:764)
  0xC454504: gst_ffmpegdec_frame (gstffmpegdec.c:1331)
  0xC45635D: gst_ffmpegdec_chain (gstffmpegdec.c:2236)
  0x5303C06: gst_pad_chain_unchecked (gstpad.c:3527)
  0x530421C: gst_pad_push (gstpad.c:3695)
  0xB9C0A3E: gst_queue_loop (gstqueue.c:1024)
  0x531E418: gst_task_func (gsttask.c:192)
  0x5F4338E: g_thread_pool_thread_proxy (gthreadpool.c:265)
  0x5F41C4F: g_thread_create_proxy (gthread.c:635)
For this level of information, you have to run massif with special options. I ran my test like this:
G_SLICE=always-malloc valgrind --tool=massif --depth=30 ./.libs/lt-vid-player
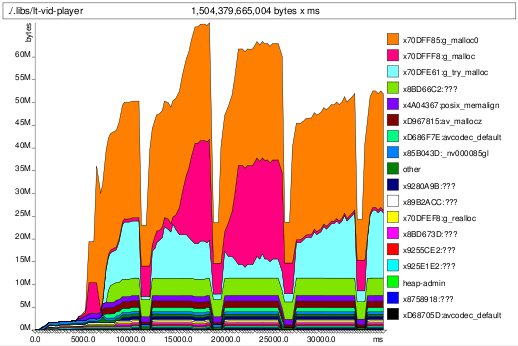
So now that I knew what was leaking, I decided to run with fewer, longer cycles to see the allocation characteristics were. And thus, exhibit B:
 bucket effect -- watch the cyan trough fill up
You can see that after the video was removed from the scene the cyan part representing g_try_malloc allocation does not drop down to zero; indeed it starts to "fill up the trough", getting larger at each iteration.
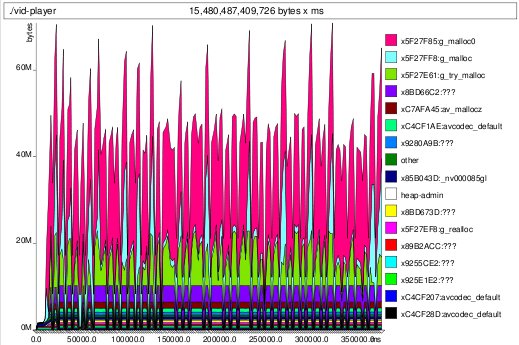
Of course at this point I realized that I probably wasn't freeing the buffer that I kept as a queue between the GStreamer and GL threads on teardown. Indeed, indeed. Two lines later and we have the much more agreeable long-term plot:
 memleak fixed
Moral of the story: "proof of correctness" is not proof of correctness.
Valgrind turned out to be much more useful to me in this instance than it was when I looked at before, when hacking Python. But again, the CVS/3.3 version was of no use, yet. Since then, 3.3 does indeed do graphs again, but in ascii. As a palliative, the textual output appears to have improved. Still, ascii graphs?
4 responses
Comments are closed.
I don't understand the problem, really. I am a KDE guy and we occasionally check our code with valgrind. Just use the distro package, valgrind --tool=memcheck first for the obvious leaks (didn't that work for you?) and then valgrind --tool=massif for the leaks where you still have the reference to a piece of memory that is not useful anymore.
This is so easy that in most cases every other approach (like combing through code) is a complete waste of time.
In the future, try using Valgrind's --alloc-fn option to ignore functions like g_try_malloc and g_malloc in the graph. They'll give you more useful function names in the legend.
Unfortunately, valgrind >=3.3.0 has stopped producing those graphs from the ms_print utility. You get a text file instead.
My main problem with using valgrind with Python programs was that the pymalloc allocator prevented valgrind from tracking most allocations.
I put together a patch that allows Python to disable pymalloc if it detects it is running under Valgrind, but it hasn't been merged yet. This covers most cases, but there are still a few caches that can hide problems.