soot, solar, sedimentation, sin, & 'centers
Good evening, friends. Tonight I have a few loosely-knit stories.
soot
A couple years ago, my house was heated by a condensing gas boiler. It was awful from both an environmental and a geopolitical perspective: environmental, as I would emit somewhere around 2.5 tons of CO2 equivalent per year to heat my home, which compares poorly to the target total CO2e emissions of 2 tons per year per person; and geopolitical, because although France gets 40% of its gas from Norway, with whom we have no beef, all the rest is a problem in some way. (Algeria, 10%, is the least of my worries; the 20% for Russia and the US respectively are the most, followed by 10% for the Gulf states.)
Still, natural gas is better than fuel oil, which we had at my former rental house. It is a lamentably visceral experience to call up the fuel provider and say, yes, s’il vous plaît, can you drive a diesel-powered tanker truck out to my house, unroll the hose, and pour out 1500 liters of toxic fuel oil into a tank under my garden. Yes, I will just burn it all. Sure, see you again next year.
Some friends of mine recently had their fuel boiler die, which is itself an experience: one of them came over to visit, completely covered in soot, saying that the chimneysweep (whom he also has to call every year) said that his boiler is on its way out, that the chimney is completely clogged, and now because of the cleaning his basement is also covered in soot; awful. What to replace it with? Apparently despite the prohibition on new fuel-oil boiler installs, it might be possible to just install a new one; or they could hook up to natural gas from the street; or they could install a heat pump. Which to do?
To all these questions there is a moral answer, which we can phrase in terms in CO2 emissions and localized PM2.5 pollution, and it is always and everywhere to stop burning things. But fortunately we don’t need to rely only on moralism: electrification is just better, in essentially all ways. Owning and operating an electric car is a better experience than a petrol car. Induction stoves are better than gas; I know, I did not believe this for the longest time, but I was wrong. The experience of using a heat pump is pretty much equivalent to gas, so it’s a harder sell, but it is a relief to no longer have a pressurized methane tube connected to my house.
In the end, I think my neighbors are going to go for the heat pump, despite the 20k€ price tag, labor included. (Oddly, I think the deciding factor was that my neighbor confessed to having had a long chat with an AI chatbot, after which she felt she had a good understanding of the proposed solution and its tradeoffs; make of that what you will!)
solar
In late November I got some brave lads to install nineteen solar panels on my roof. Each of these magic rectangles can make up to 500W of power in optimal conditions, but my house faces south, with the roof inclined east and west, so it’s unlikely that I will ever hit the full 9.5 kW of potential power.
December was... very dark. The panels produced a total of 145 kWh over the month, but I used 1250 kWh of electricity, essentially all to run the heat pump. I live in a basin that is mostly covered by low clouds from November to February, and slanty photons couldn’t make much headway through the fog. The house is well-insulated (20-25 cm of wood-fiber exterior insulation on sides, 40 under the roof, though it is an old house with a few less-insulated bits), so it’s not that I am leaking lots of heat, and I have a combination of low-temperature floor heating and low-temperature radiators, so it’s not that I’m running the heat pump inefficiently to generate a too-high output temperature; it’s just, you know, cold in winter. A typical day would be between 1 and 5 degrees C. Cold; cold and dark.
Things got a little better in January: 285 kWh produced, though the heating needs are higher than in December, with 1450 kWh total consumed. In February we grew to 419 kWh produced, for 850 kWh consumed. In March we equalized, with about 850 kWh produced and consumed, but although the bulk of my consumption in this month is for heating, the “need” to heat overnight meant that I consume from the grid overnight, but feed in to the grid during the day. I have a small battery (7 kWh), but it’s not enough to store the “excess” electricity generated in a day; I should probably arrange to have the system heat only during the day in these months, to avoid taking from the grid.
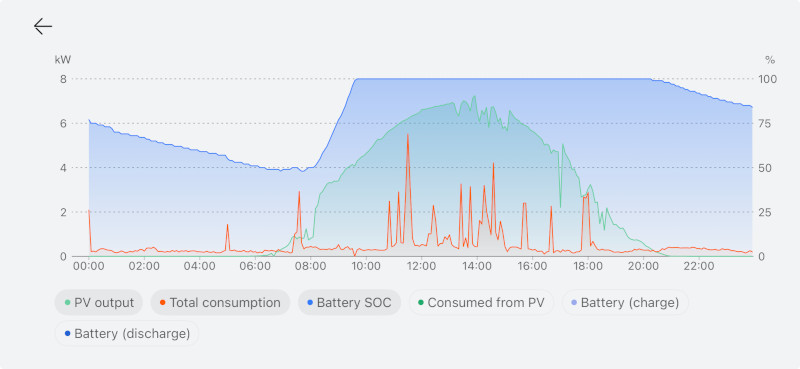
With practically no heating needs now, as you can imagine, I am just feeding a lot of excess to the grid. We’re halfway through May, just coming through a cold snap (the peasant lore is that we just passed the saints de glace, the date you need to wait for to plant crops that aren’t frost-hardy), but still we’ve produced more than twice as much as we’ve consumed (550 kWh vs 220 kWh), and essentially all the excess goes to the grid. The 7 kWh battery is quite enough to cover night-time electricity needs.
I didn’t know before, but often a solar panel installation doesn’t work when the grid is down. This is because the inverters that convert the DC from the panels to AC for the house need to match phase with the grid, and if the grid’s phase signal is down, they stop. It’s also for safety, so that line workers can repair downed lines without worrying that every house is a live wire. I spent a little extra to install a cutout that allows the house to run in “island mode” if the grid is down. We almost never have that situation here, though, but it seemed prudent that if we were going all-in on electricity, that perhaps we should take precautions.
When you buy a solar installation, you can either have little DC/AC inverters attached to the back of each panel (microinverters), or feed DC from all panels wired in series (they call them strings; there may be 2 or 3 of them in a home setup) to a central inverter. I have the latter. The panels happen to be assembled locally by MaviWatt, though surely the cells themselves are from China. My panels are installed on top of the ceramic roof tiles with little clips and an aluminum structure. (It used to be that sometimes panels would replace tiles and become the roof. That’s not done so much any more here.) Installation is, like, 60% of the price of solar. Often you need scaffolding, though my installers just used ladders; perhaps living in the mountains where I am, there are more people used to doing ropes and rock-climbing and such. I don’t think they took as much care of themselves as they should, though.
My inverter is made by Huawei (SUN2000), as is my battery and the cutout (“backup”) box. Some batteries have their own microinverter, allowing them to consume and produce AC, but this one is DC, hence the need to have the same brand as the inverter. It sends all my electricity usage data to China or something, so that it can send it to the app on my phone. It’s not ideal from an geopolitical perspective but it is good kit.
sedimentation
Although we haven’t hit the height of summer yet, I would like to offer a few observations that have precipitated out of solution.
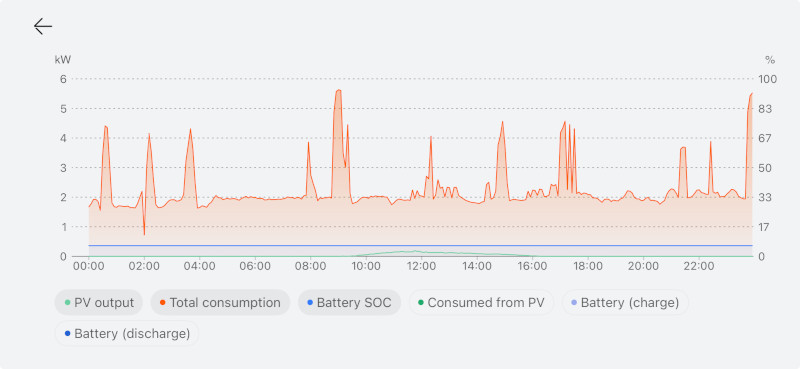
Firstly, at least in my house, the baseline load without heating is pretty low: 200 or 300 watts or so. (I didn’t know this before looking at Huawei’s app.) We have a recently renovated, not tiny, but otherwise normal sort of house with, you know, the usual lot of modern conveniences, idle chargers plugged in here and there, and also my work computers and such, and it all runs on less than a handful of the old 60W bulbs. That’s interesting.
As far as actual load, there are only a few things that count: heating, when it’s cold; it can easily average 2 kW on a cold day. Plug in the electric car (I don’t have a wall box yet, just with the mains plug), that’s another kilowatt. I hardly drive, though, so it’s not a huge load. Using hot water is perhaps the most surprising thing: it can cause a spike up to 6 kW, over a short time, despite the heat coming from the heat pump; probably there is some tuning to do there. The oven and stove are little tiny blips. There’s the kettle, but it’s also a little blip. Nothing else matters: not the dishwasher, not the washing machine, nothing. You can leave the lights on all day and it just doesn’t matter.
Call me naïve, but I had hoped that solar would help my electricity usage in winter. This is simply not the case. Though the heat pump is efficient, there does not appear to be a magical energy solution for December, which is the bulk of my energy usage. My electricity bill is fixed-rate: 20 cents per kWh used. Using 4000 kWh or so from the grid over winter costs me 800€; annoying. I don’t have a natural before-and-after experiment as we added on to the house as we were renovating, but for context, in my previous poorly-insulated rental house that was half the size of this one, we’d pay 2000€ or so per year for heating oil. Perhaps I can lower the 800€ via variable-rate metering, to let the battery do some arbitrage, but there are some fundamental constraints that can’t be finagled away.
When I got my solar panels, I was resigned to never getting peak power, as they are on two different sections of the roof. It turns out that doesn’t matter: firstly, because 9.5 kW is a lot of power, as you can appreciate from the numbers above. I could never do anything with 9 kW. But secondly, because power isn’t equally valuable at different times of the day: by having east and west roof pitches, I can start producing earlier and continue producing later than if I had, say, a flat roof with panels tilted to the south. And the morning and the evening are the peak hours both for my house and for the grid, so that lets me consume more of my local production both when I need it and when the grid is under higher stress.
I was interested to hear that Alec Watson of Technology Connections had reservations about residential rooftop solar. I found a video in which he explains his perspective, which has a delightfully socialist character. His beef is partly due to the net metering scheme in some parts of the US, in which each kWh fed to the grid makes your meter run backwards; Watson finds it unfair, because it lets those wealthy households who have the capital to install solar to opt out of paying for the grid, which is a social good. In some cases, these households actually capture a part of what consumers pay for the grid, unlike industrial producers who are paid wholesale rates that don’t include transmission. Also, he finds it less efficient overall to install solar panels on houses rather than in bigger solar parks; each euro that society allocates to solar would go farther if we pooled them together.
Both points are interesting, but I would offer a couple responses. Firstly, at least in Europe, net metering is not really a thing; we have smart meters and I hear from friends in Portugal that there can even be a charge for grid injection at some times, if the grid is overloaded. France’s case is a bit weirder; I wouldn’t have gotten as large a system as I did, but there was a government program to offer a fixed buyback rate of 7 cents per kWh, stable for 20 years, if you installed more than 9 kW of panels. But given the lack of solar in December, I still pay the grid when I need energy the most.
Putting solar panels on roofs is indeed less efficient than putting them on a field. But, we are not in a situation of scarce solar panels: China could make another 350 GW of panels this year if there were demand. An incentive like the 7-cent buyback rate encourages capital allocation to solar, effectively calling these panels into existence. The bank loans me 20k€ at 4%, and the elimination of 3000 kWh that I would have bought from the grid in a year plus the 9000 kWh that I sell to the grid covers the cost entirely, and I get a life insurance policy on the remaining principal. It’s not a great investment financially but it doesn’t cost me anything either.
sin
As a person with a conscience, I have always experienced questions of energy as questions of sin; to leave a light on is not simply inefficient but a moral failing. Each kilometer a car travels on fossil fuel carries with it a quantum of guilt and must be justified in some way, otherwise a moral stain attaches.
Solar panels and electrification changes all this. 8 or 9 months out of the year, I live in a world of abundance: the electrical generation capacity that I have called into existence is free, clean, and much, much more than I need. Owning and operating a car still has externalities, but the emissions and cost aspects are entirely gone. It’s a funny feeling, and disorienting.
I grew up in the south of the US, where everyone has air conditioning. I came to see it as sinful, too; burning things and making emissions just so you could be a bit more comfortable. I haven’t lived in air conditioning since then, but it does get hot in summer, and I would be more comfortable if I could pump heat out of my house. Now I can. I have excess power available right when air conditioning (or, in my case, floor cooling) is needed. On a societal level, solar plus air conditioning is going to be a key part keeping our cities liveable while we ride out higher temperatures.
‘centers
It is with a sense of dissonance, then, that I have been experiencing Datacenter Discourse™: there is a lingering language of sin proceeding from an environmentalism born in penury, in a world in which every kilowatt-hour is precious and scarce. If China has unallocated capacity for another 350 GW of panels this year, why stress about a few GW of datacenters?
Of course, there are many aspects to these AI datacenters, but today I am just thinking about energy. Given that each GW of datacenter places extra demand on a grid, equivalent to 3 million times my home’s baseline load, or maybe 300 thousand of its winter load, if society wants this kind of datacenter to be a thing, it needs to add that amount of clean energy to the grid, with adequate battery storage to even out supply. We should, as a society, require this via legislation, because the market seems only too happy to use natural gas or even coal if it is marginally cheaper. At least if the datacenter boom busts, we’d be left with more clean energy production.
Conversely... and I don’t think I’m going too far here, but causing new fossil generation to come online in 2026, or even prolonging the life of existing generation, should result in the state confiscating all property of those responsible. (I have moderated my previous position, which was hanging.) Such people are not fit to live in society, so society should not allow them to own things.
Anyway. I think that those of us that wish “AI” were not a thing are losing the battle, and that we should prepare to fall back to more defensible positions; otherwise we risk a rout. A requirement to bring additional clean capacity online in sufficient amounts should be a baseline ask when it comes to datacenters. We have the productive capacity in the form of solar panels, at an affordable price, more than enough space in terms of the existing cropland that is inefficiently turned into ethanol to burn, batteries are a thing, and we just lack the political will to turn what could be into what is.
And as for AI datacenters themselves: there are enough aspects to argue about as it is. We do ourselves a disservice by weighing down the Discourse with outdated ideas of what is and isn’t possible.